Feature #450
openDashboard
Start date:
01/03/2025
Due date:
% Done:
10%
Estimated time:
Owner(Agency):
Travvise
Time Taken(HH):
Module:
Dashboard
Tested By:
Code Reviewed By:
Files
| clipboard-202501101658-qoj2j.png (56.9 KB) clipboard-202501101658-qoj2j.png | |||
| Dashboard1.jpg (108 KB) Dashboard1.jpg | |||
| Dashboard2.jpg (107 KB) Dashboard2.jpg | |||
| Dashboard3.jpg (117 KB) Dashboard3.jpg |
Subtasks
Related issues
Updated by Arathy PS 4 months ago
Dashboard Design
=================
Welcome to TAAS -> Full width

Block1      Block2
Block3      Block4
Block5      Block6

? Expiry Reports(10 Days <)
? Limit (90 % or > Use)

Block1->User/Counter/Employee/Counter Staff(Imp) Target
--------------------------------------------------
Type -> Chart
Input ->
Items ->

Block1->Pending System Works -> Normal Info Message
------------------------------
Type -> List
Input -> Current Date
Items -> Year End,

Block2->Messages - Note, Expiry Reports, Limit (90 % or > Use) etc..
------------------------------
Type -> List
Input ->
Items -> Notes(Reminder Users Notes), To Do List(New Module), Reminder(New Module)

Block3->Approval Pending(Count)
------------------------------
Type -> Chart
Input -> Current Date
Items -> Account, Document, Posting, Credit, Corporate Receipt, Cheque Submission

Block4->Purchase(Cost)
--------------------------
Type -> Chart
Input -> Current Date(No Data the Prv date)
Items -> Booking, Issue, Cancel, Void,

Block5->Sale(Price & Count) - Booking, Issue, Sale and Direct Void, Cancel, Refund -
--------------------------
Type -> Chart
Input -> Current Date(No Data the Prv date)
Items -> Sale, Refund, Net
Updated by Arathy PS 4 months ago
- File clipboard-202501101658-qoj2j.png clipboard-202501101658-qoj2j.png added
- Status changed from New to Reopen Bugs
- % Done changed from 0 to 50
ISSUE FOUND
------------------------------------------------------
1. FIXED-- Any message that appears while logging out will still be present on the dashboard after logging in.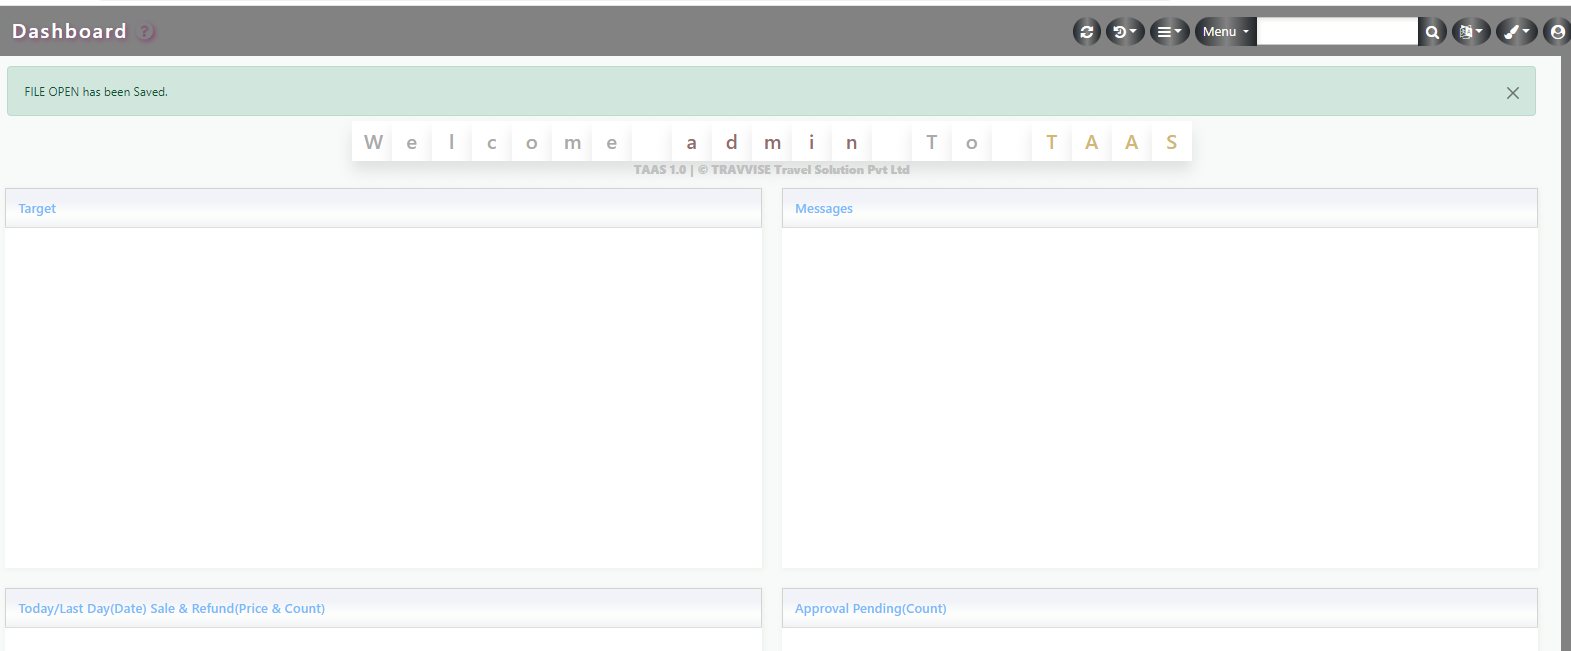
Updated by Junaid M about 2 months ago
- File Dashboard1.jpg Dashboard1.jpg added
- File Dashboard2.jpg Dashboard2.jpg added
- File Dashboard3.jpg Dashboard3.jpg added
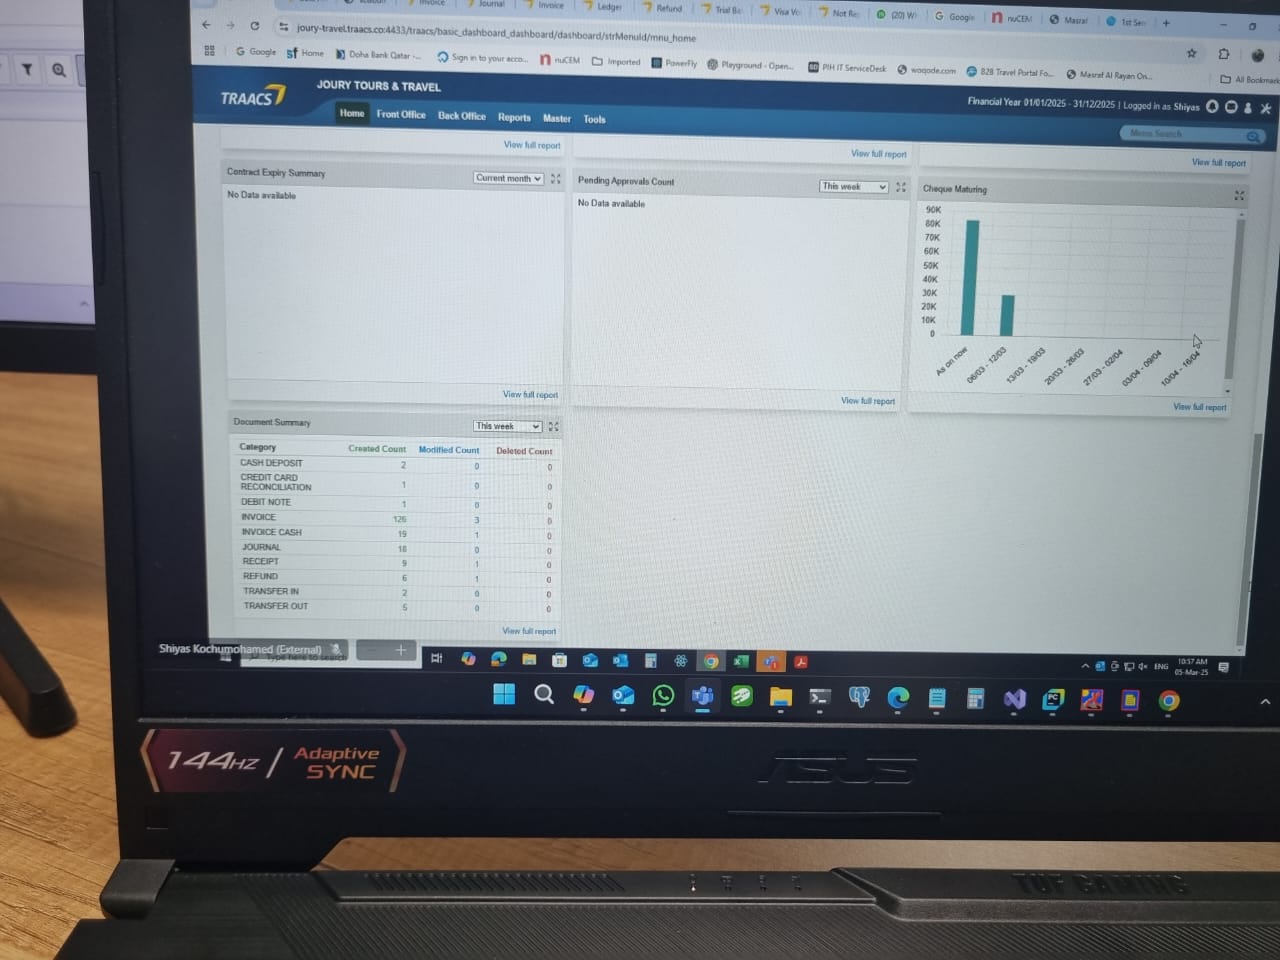
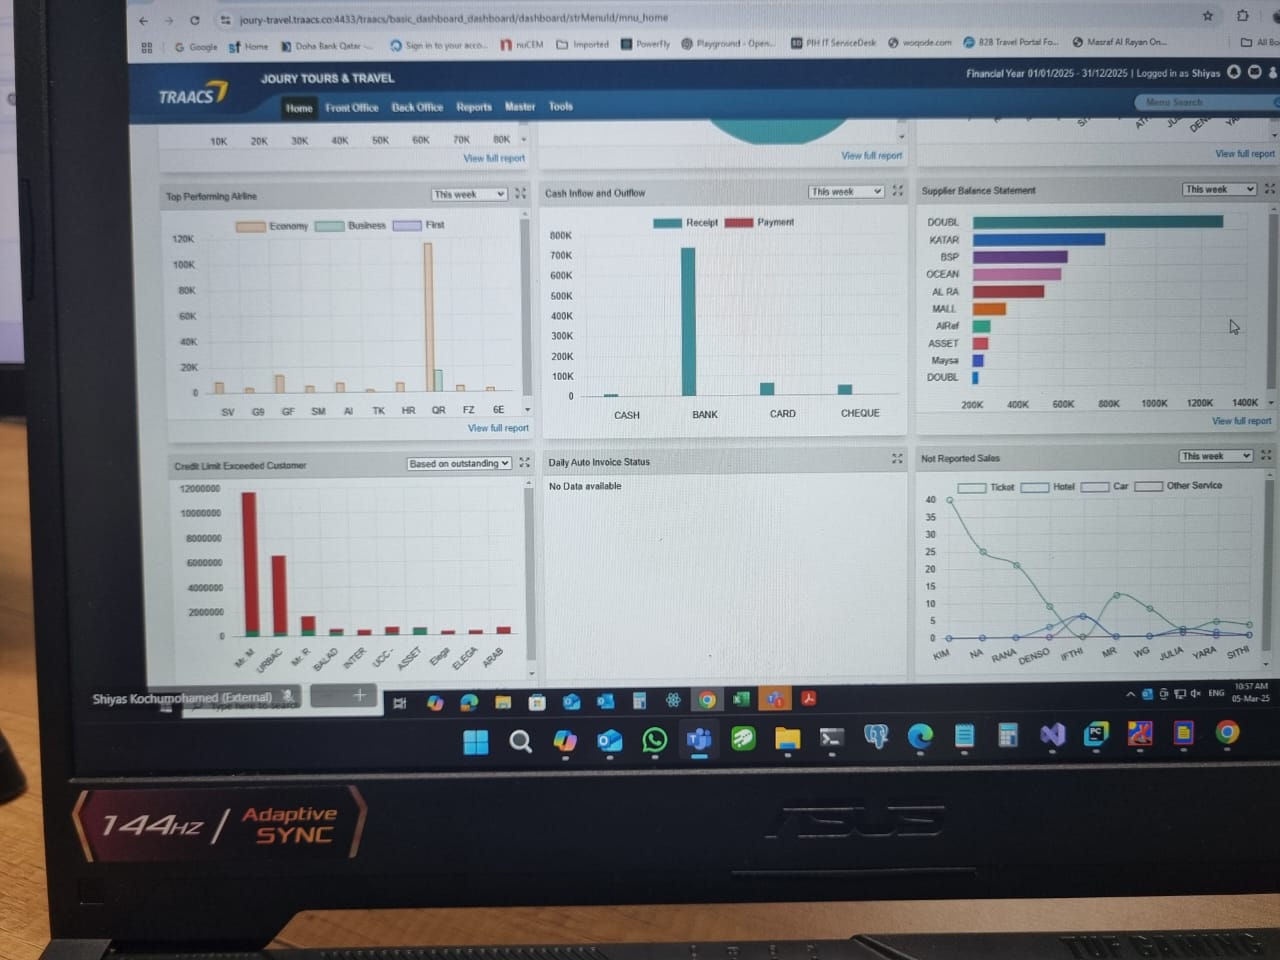
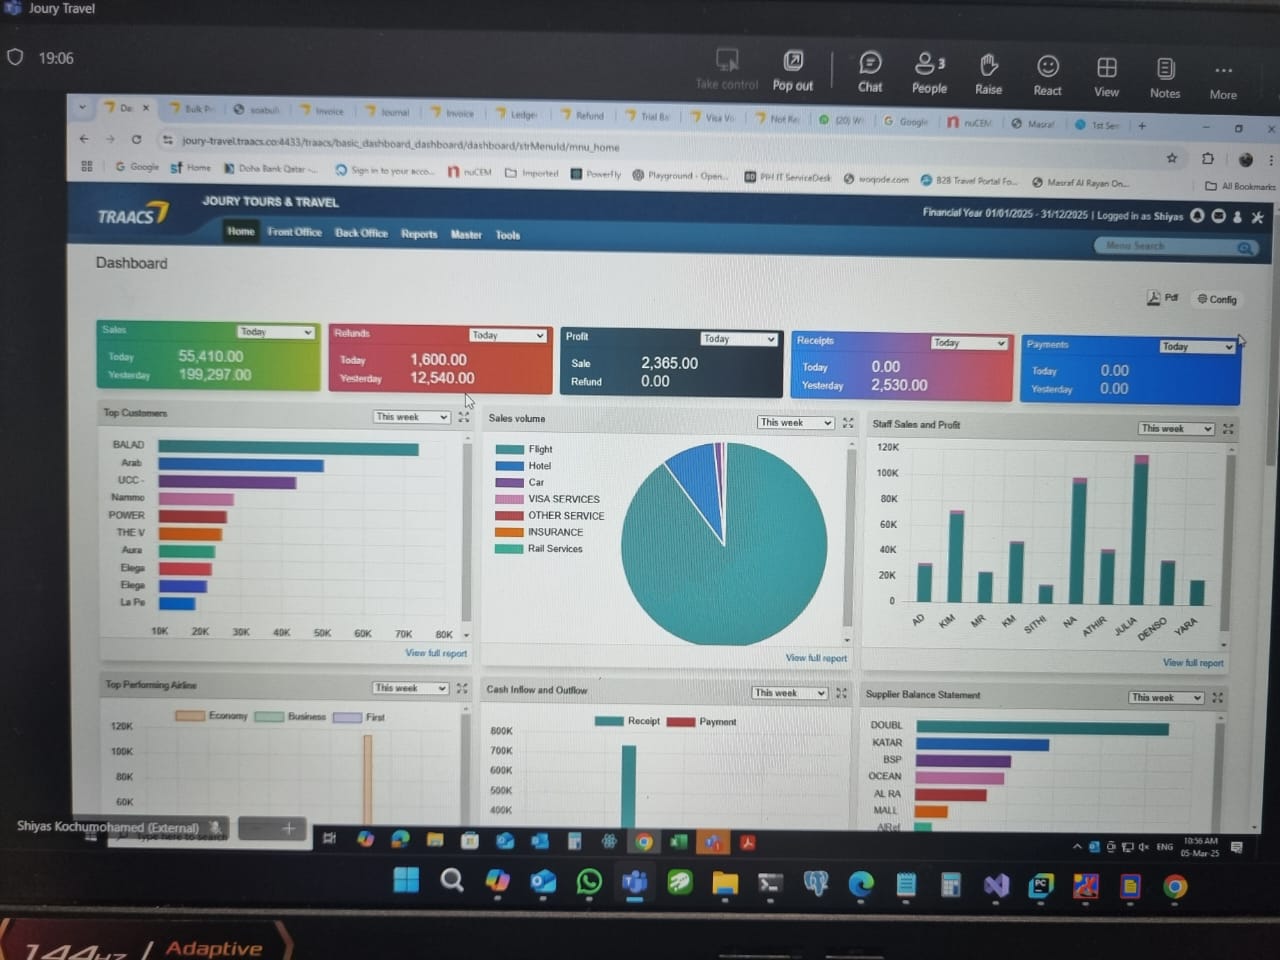
Joury Travels Dashboard
Updated by Anil KV 4 days ago
Sample Chart
--------------------
https://js.devexpress.com/Angular/Demos/WidgetsGallery/Demo/Charts/Overview/MaterialBlueLight/
https://js.devexpress.com/Angular/Demos/WidgetsGallery/Demo/Charts/StackedBar/MaterialBlueLight/
https://js.devexpress.com/Angular/Demos/WidgetsGallery/Demo/Charts/SideBySideStackedBar/MaterialBlueLight/
https://js.devexpress.com/Angular/Demos/WidgetsGallery/Demo/Charts/Doughnut/MaterialBlueLight/
https://js.devexpress.com/Angular/Demos/WidgetsGallery/Demo/Charts/DiscreteData/MaterialBlueLight/
https://js.devexpress.com/Angular/Demos/WidgetsGallery/Demo/Charts/FunnelChart/MaterialBlueLight/
-----------------------

Block1 Block2
Block3 Block4
----------------------
Block1
=========
=>Div Header

=>Graph
->Heading Sale(periodFrom-Period To)
*Today - One Date
->Y -> Sale, Refund, Void, Issued, Cancel
->X ->Today, This Week, This Month, Last Month
*Login User Branch
*Amount is Price
*Chart Type is 'bar'

Block2
=========
=>Div Header
->Heading -> Branch Wise Sale
->Period -> Selectbox -> Today, This Week, This Month, Last Month
*'Today No' date then 'This Week'(Sun - Sat ) No date then 'This Month' No date then 'Last Month'
->Load Button -> Only Icom
=>Graph
->Heading Sale(periodFrom-Period To)
->Y->Consider Sales+Issued Status Only
->X -> Branch
*Amount is Price
*Chart Type is 'pie'

Block3
=========
~~~->If Set Branch wise Target then
*Like Block2 - Not need Period -> Selectbox,
*Current FY data with Target - Check sample charts
~~~>Else
if set Service group then service group wise sale, Other wise Sales Mapping

Block4
=========
-> In Div Header
-Refresh icon button in Center
->List
*Not Need List Header
-|Message|Redirect Icon |
->Grouping(Default Expend)
-Message (No need icon)
->Credit Limit Exceed(<80%)
*Eg:- 2 Customer
-Approval Pending(Count)
*Eg:- 2 Customers Approval Pending
-Passport Expiry
-Pax Type Changed